Cannabis Retail KPI Benchmarks 2025: What Actually Matters at the Counter

Cannabis retail KPI benchmarks for 2025 land in your inbox every few months from every data firm in the industry. Most operators read them, nod, and go back to running the store exactly the same way. The number is rarely the issue. The issue is holding a Michigan limited-license store up against a California rec shop fifteen minutes from the coast and expecting basket size to mean the same thing in both places.
Benchmarks work best as a drift detector. Your store against your store. Last month against this one.
Cannabis Retail KPI Benchmarks 2025: The Short List
If you track a handful of numbers this year, make it these. Everything else is detail feeding one of them.
- Average basket size, broken out by daypart as well as by month
- Units per transaction, which tells you more about budtender behavior than basket size ever will
- Conversion rate: foot traffic that bought versus foot traffic that walked back out
- Repeat purchase rate at 30 and 60 days
- Discount rate as a percentage of gross sales
- Labor cost as a percentage of revenue, by shift
Industry reports put average basket size in the mid-$30s to low-$40s depending on the market, with medical-heavy states running higher. That figure has slid three years running as price compression works through mature markets. Last year's average is already a stale target.
Why Cannabis Retail KPI Benchmarks Miss Your Store
A benchmark tells you where the industry sits. It says nothing about where your store sits against its own best month, which is the comparison that actually produces a decision. Take a store running a 22% discount rate. Above the published average, technically healthy, and still bleeding margin nobody can see, because the benchmark has no idea that store opened two locations in Q1 and is running grand-opening promos that taper off in June.
The GM reviewing Friday night's numbers after close has no use for what the average Colorado dispensary did last quarter. What she needs is the fact that basket size dropped $6 on Thursdays specifically, starting the week she cut the closing shift from three budtenders to two. That's a benchmark. It's internal, it's unglamorous, and it's the one that changes the schedule.
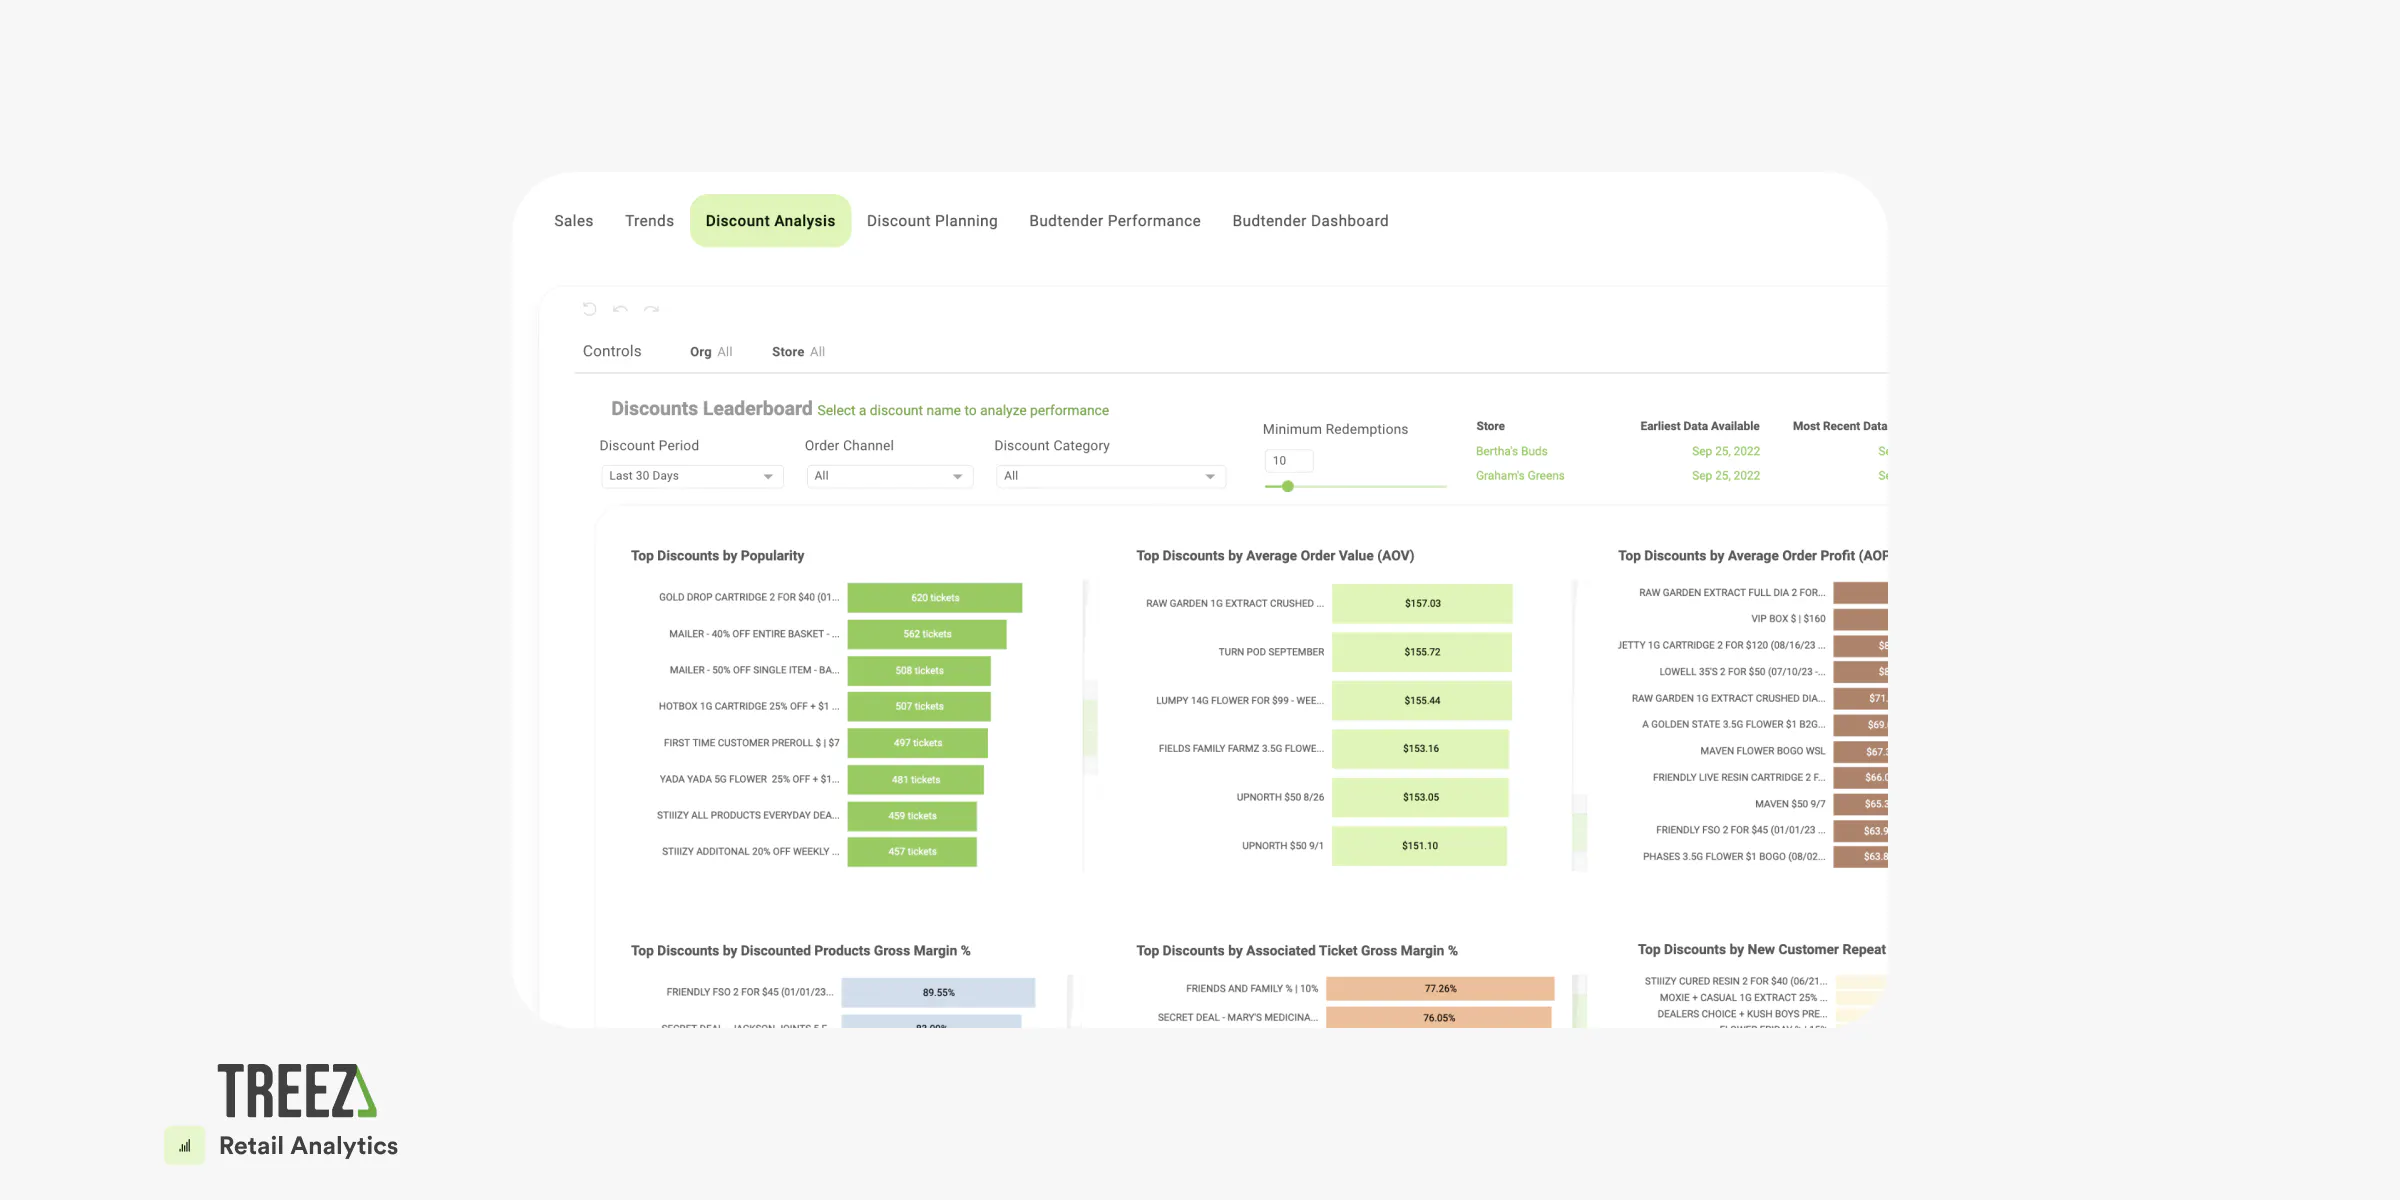
Retail Analytics is built for that comparison. Trend your own store week over week and daypart over daypart, and the published industry average drops to what it should have been all along: a sanity check you glance at twice a year.
The KPIs That Predict Trouble Before the P&L Does
Discount rate creeping up is the earliest margin warning you get, and it shows weeks before accounting confirms anything. When budtenders lean on the loyalty discount to close every sale, you have a crutch with a points label on it, and it teaches customers to wait for the next markdown. Loyalty data should answer one question: are redemptions driving visits that wouldn't have happened, or subsidizing the ones that would have?
Repeat purchase rate is the quiet one. Nobody pins it to a dashboard until retention is already falling, and by then the fix costs more than it would have in March. A store losing first-time customers after a single visit has a counter problem. Marketing won't touch it. Ecommerce gets someone through the door. What happens at the register decides whether they come back in two weeks.
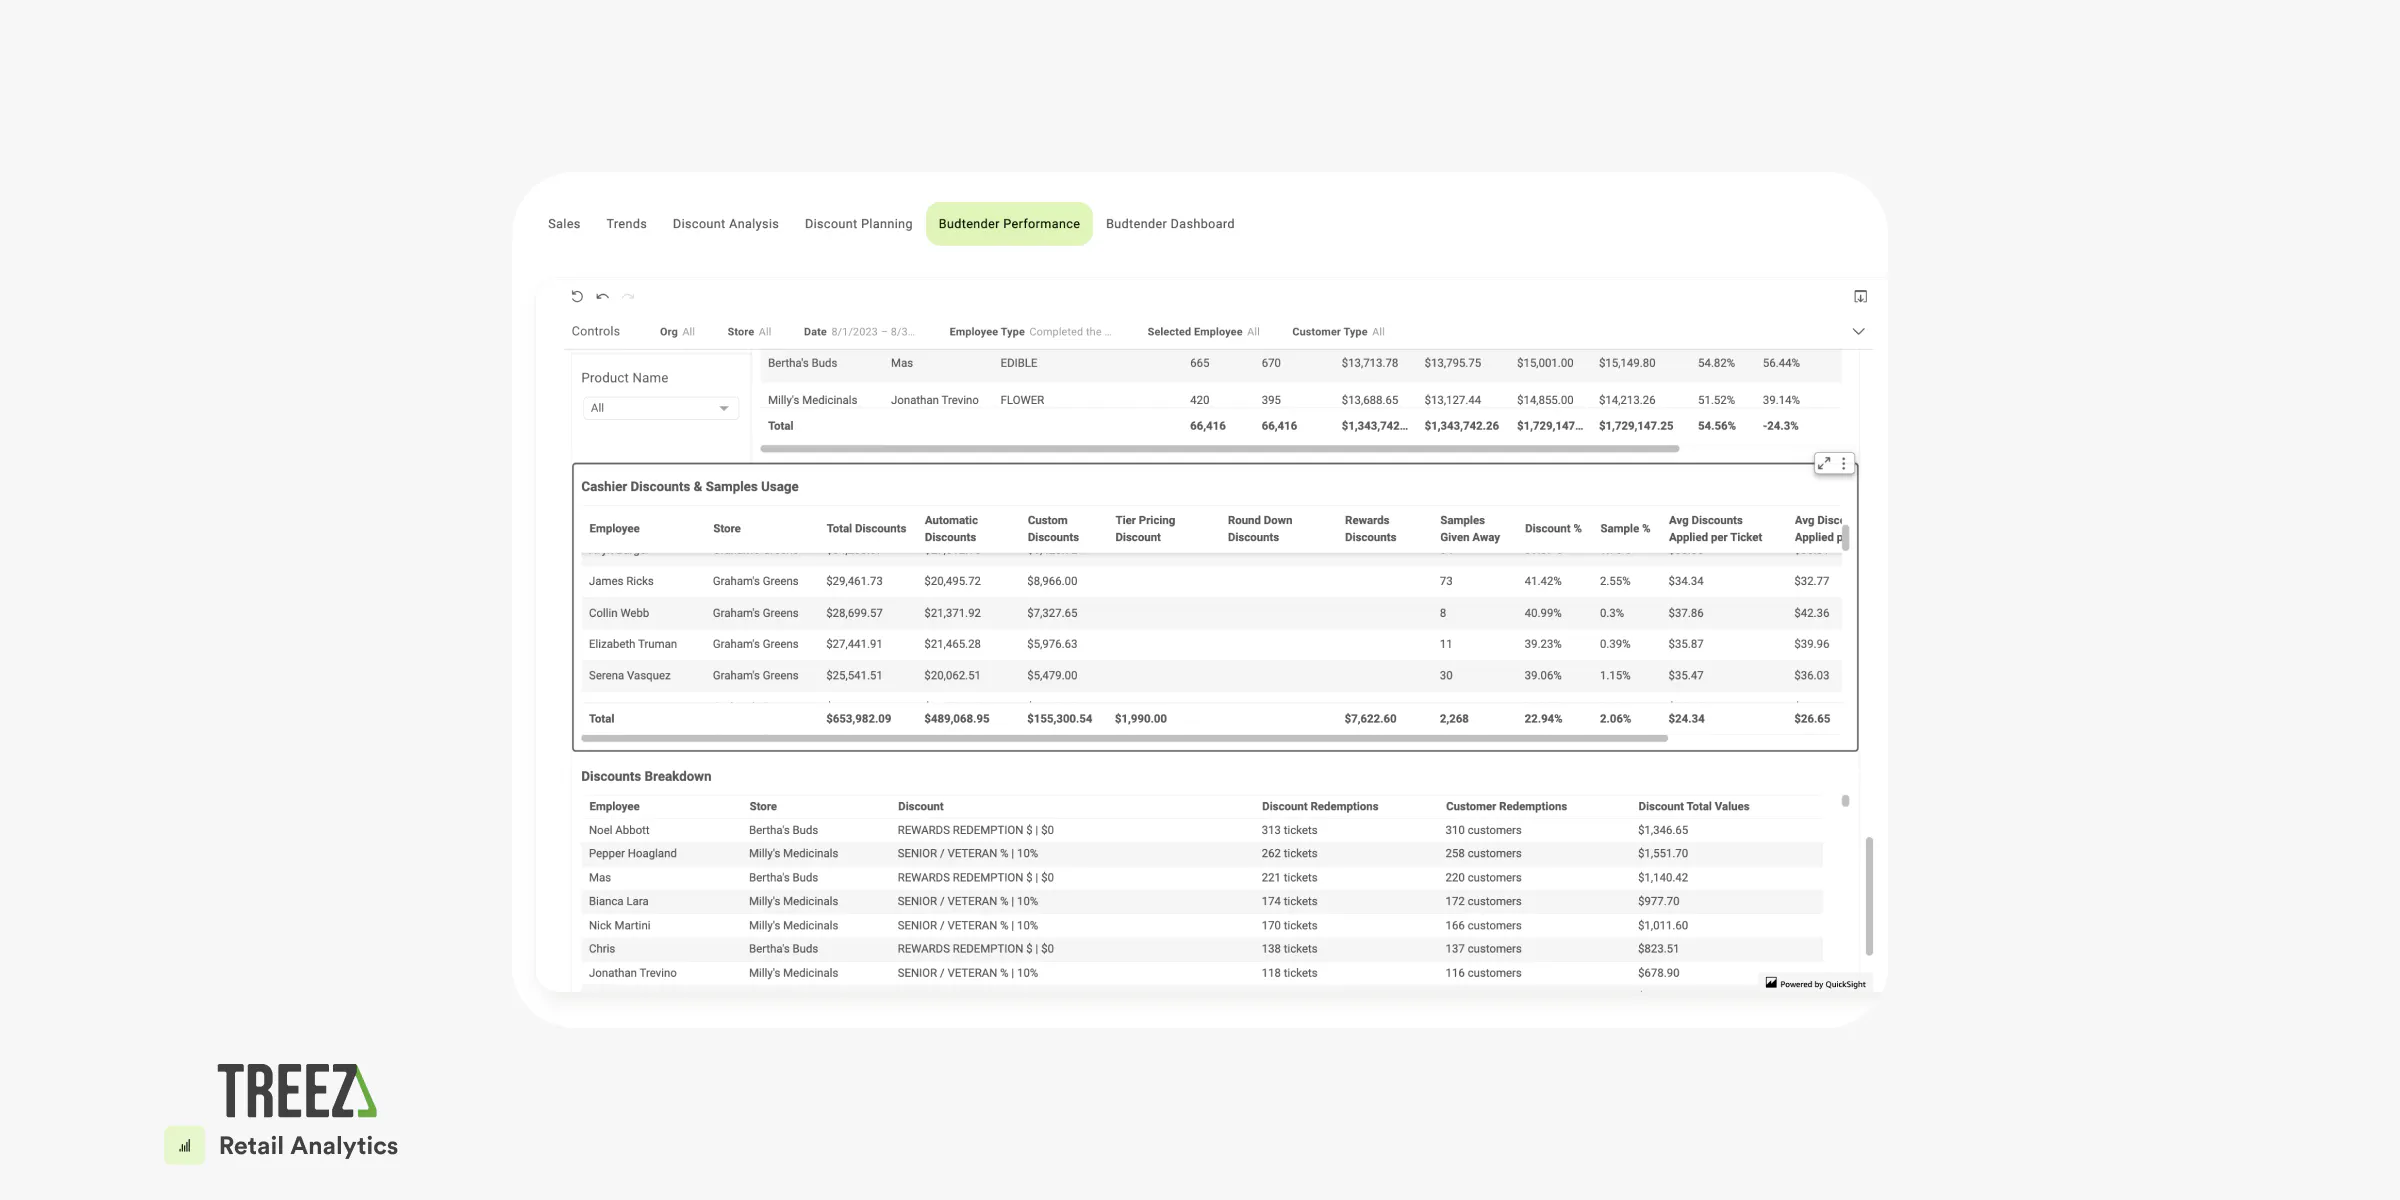
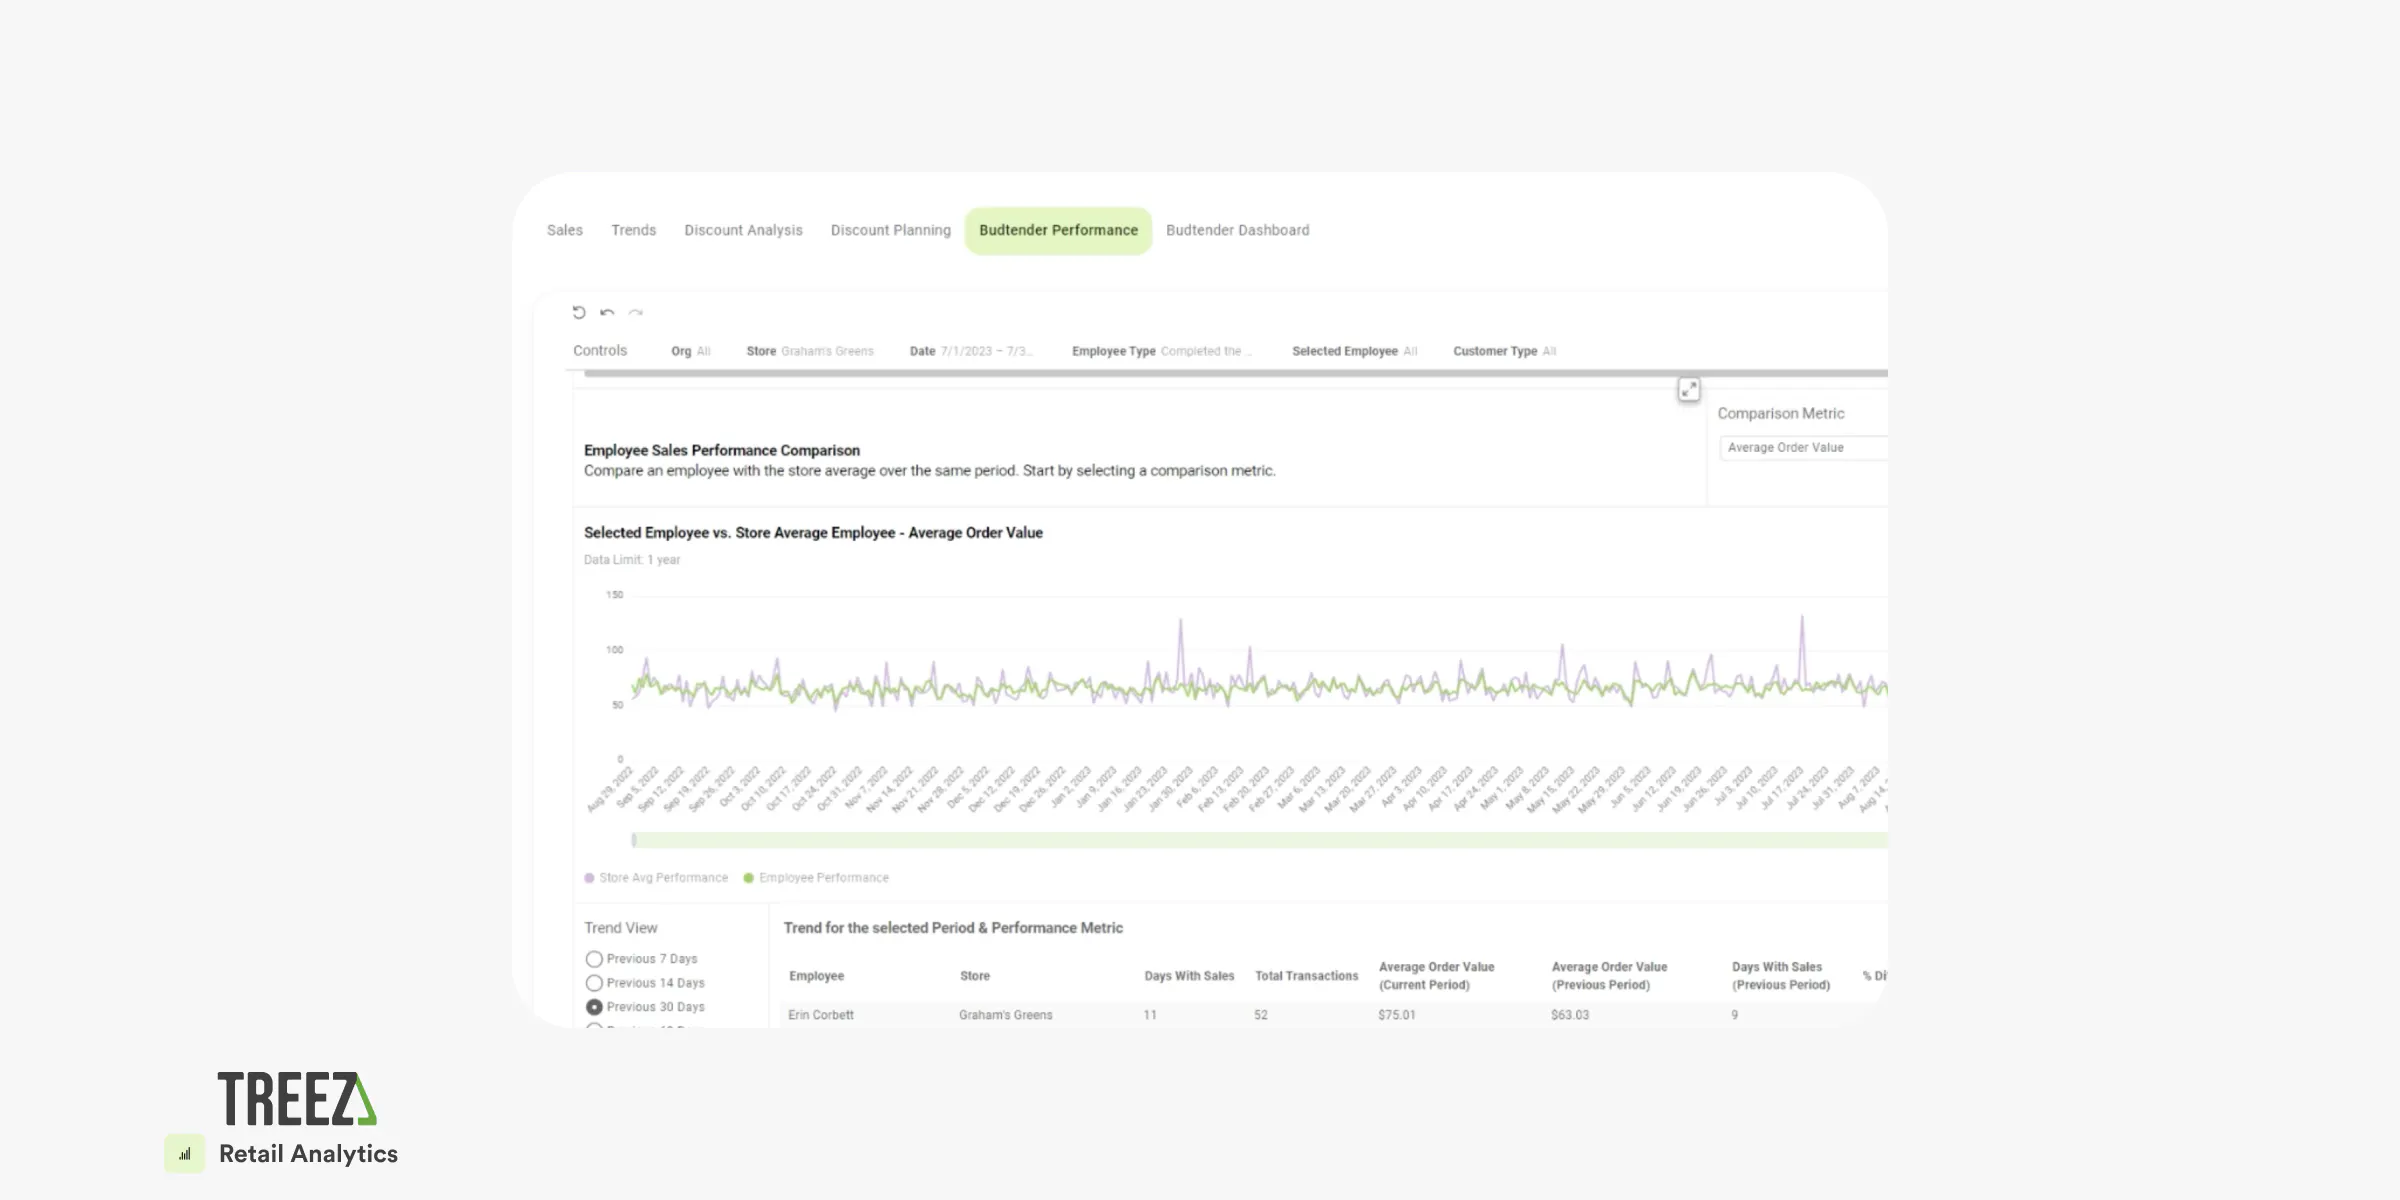
Units per transaction gets ignored because it reads like a budtender metric. It's a P&L metric wearing a lanyard. A budtender who consistently moves one extra pre-roll or edible per sale is worth tracking and worth paying more, and a Point of Sale that surfaces this by employee and by shift turns a vague hunch about who's good at the counter into a number you can coach against on Monday.
FAQ
What's a realistic basket size benchmark for 2025? Mid-$30s to low-$40s nationally, trending down year over year as prices compress in mature markets. Medical-dominant and limited-license states run higher. Store format and local competition move your basket size far more than anything on that national chart.
How often should we actually check these? Weekly at minimum for discount rate and basket size. Daily if you're mid-promotion or inside the first 90 days of a new location. Monthly reviews surface trends about four weeks after you could have done something about them.
Does switching POS systems change what we can track? It changes how fast you see it. Plenty of operators discover during a POS migration that their old system couldn't break units per transaction out by budtender shift at all. They'd been guessing on the metric that flags staffing problems earliest.