What is Sellable Velocity and Why Should I Track it?
Even the best gut decision made in cannabis retail can’t compare to that same decision, informed by data. Changes in the cannabis industry have made retailers of all sizes take a closer look at their operational DNA. They want to sell more quality products at better margins, with more efficiency, while preventing loss. One of the ways to make your sales and inventory data actionable is through something we call sellable velocity.
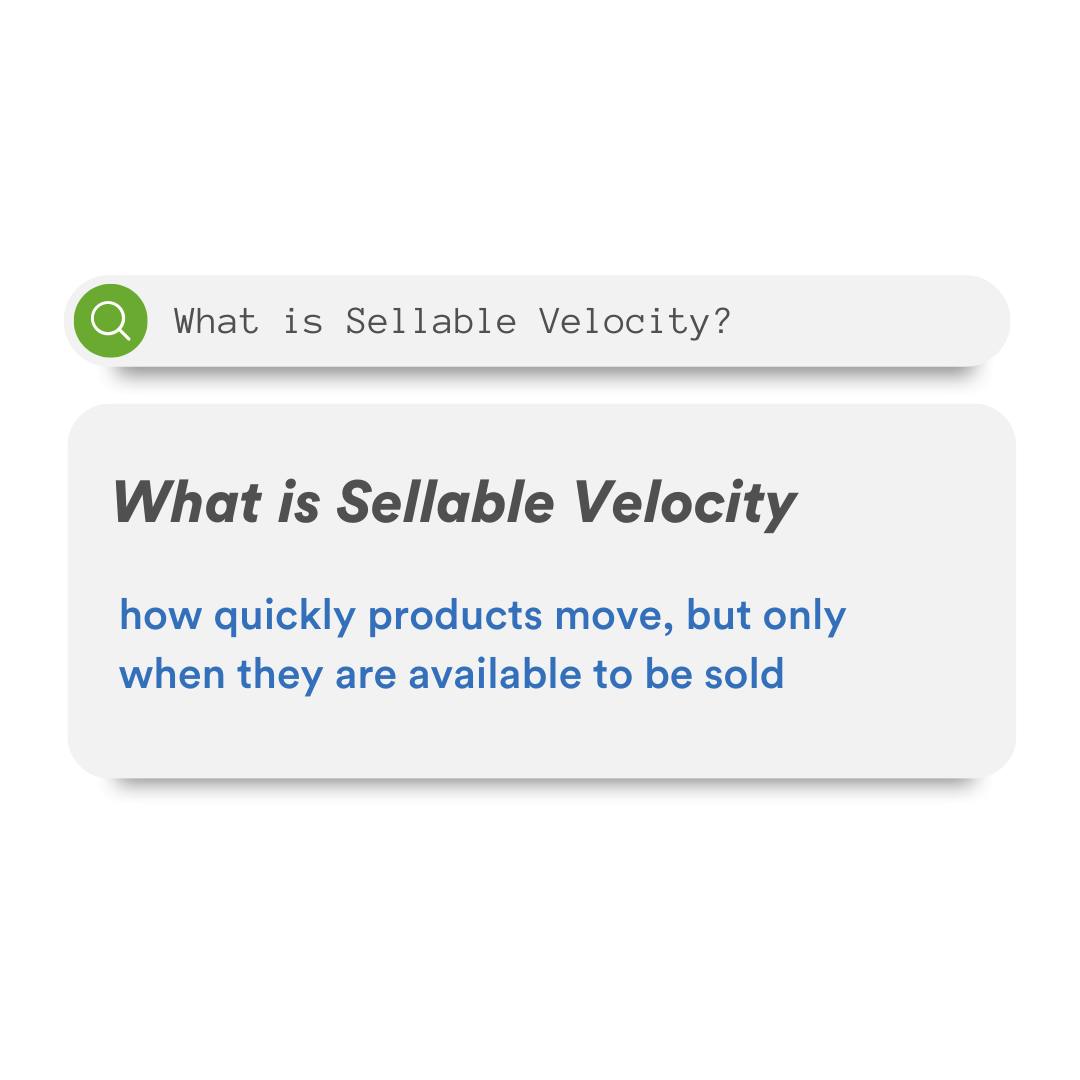
Sellable velocity is a Treez exclusive metric to judge how quickly products move, but only when they are available to be sold.
This article breaks down what sellable velocity is, how we came up with the term, and a few basic places where knowing the sellable velocity of your products could grow your business, reduce your margins, increase your profits and make things run smoother at your retail cannabis operation.
What is sellable velocity?
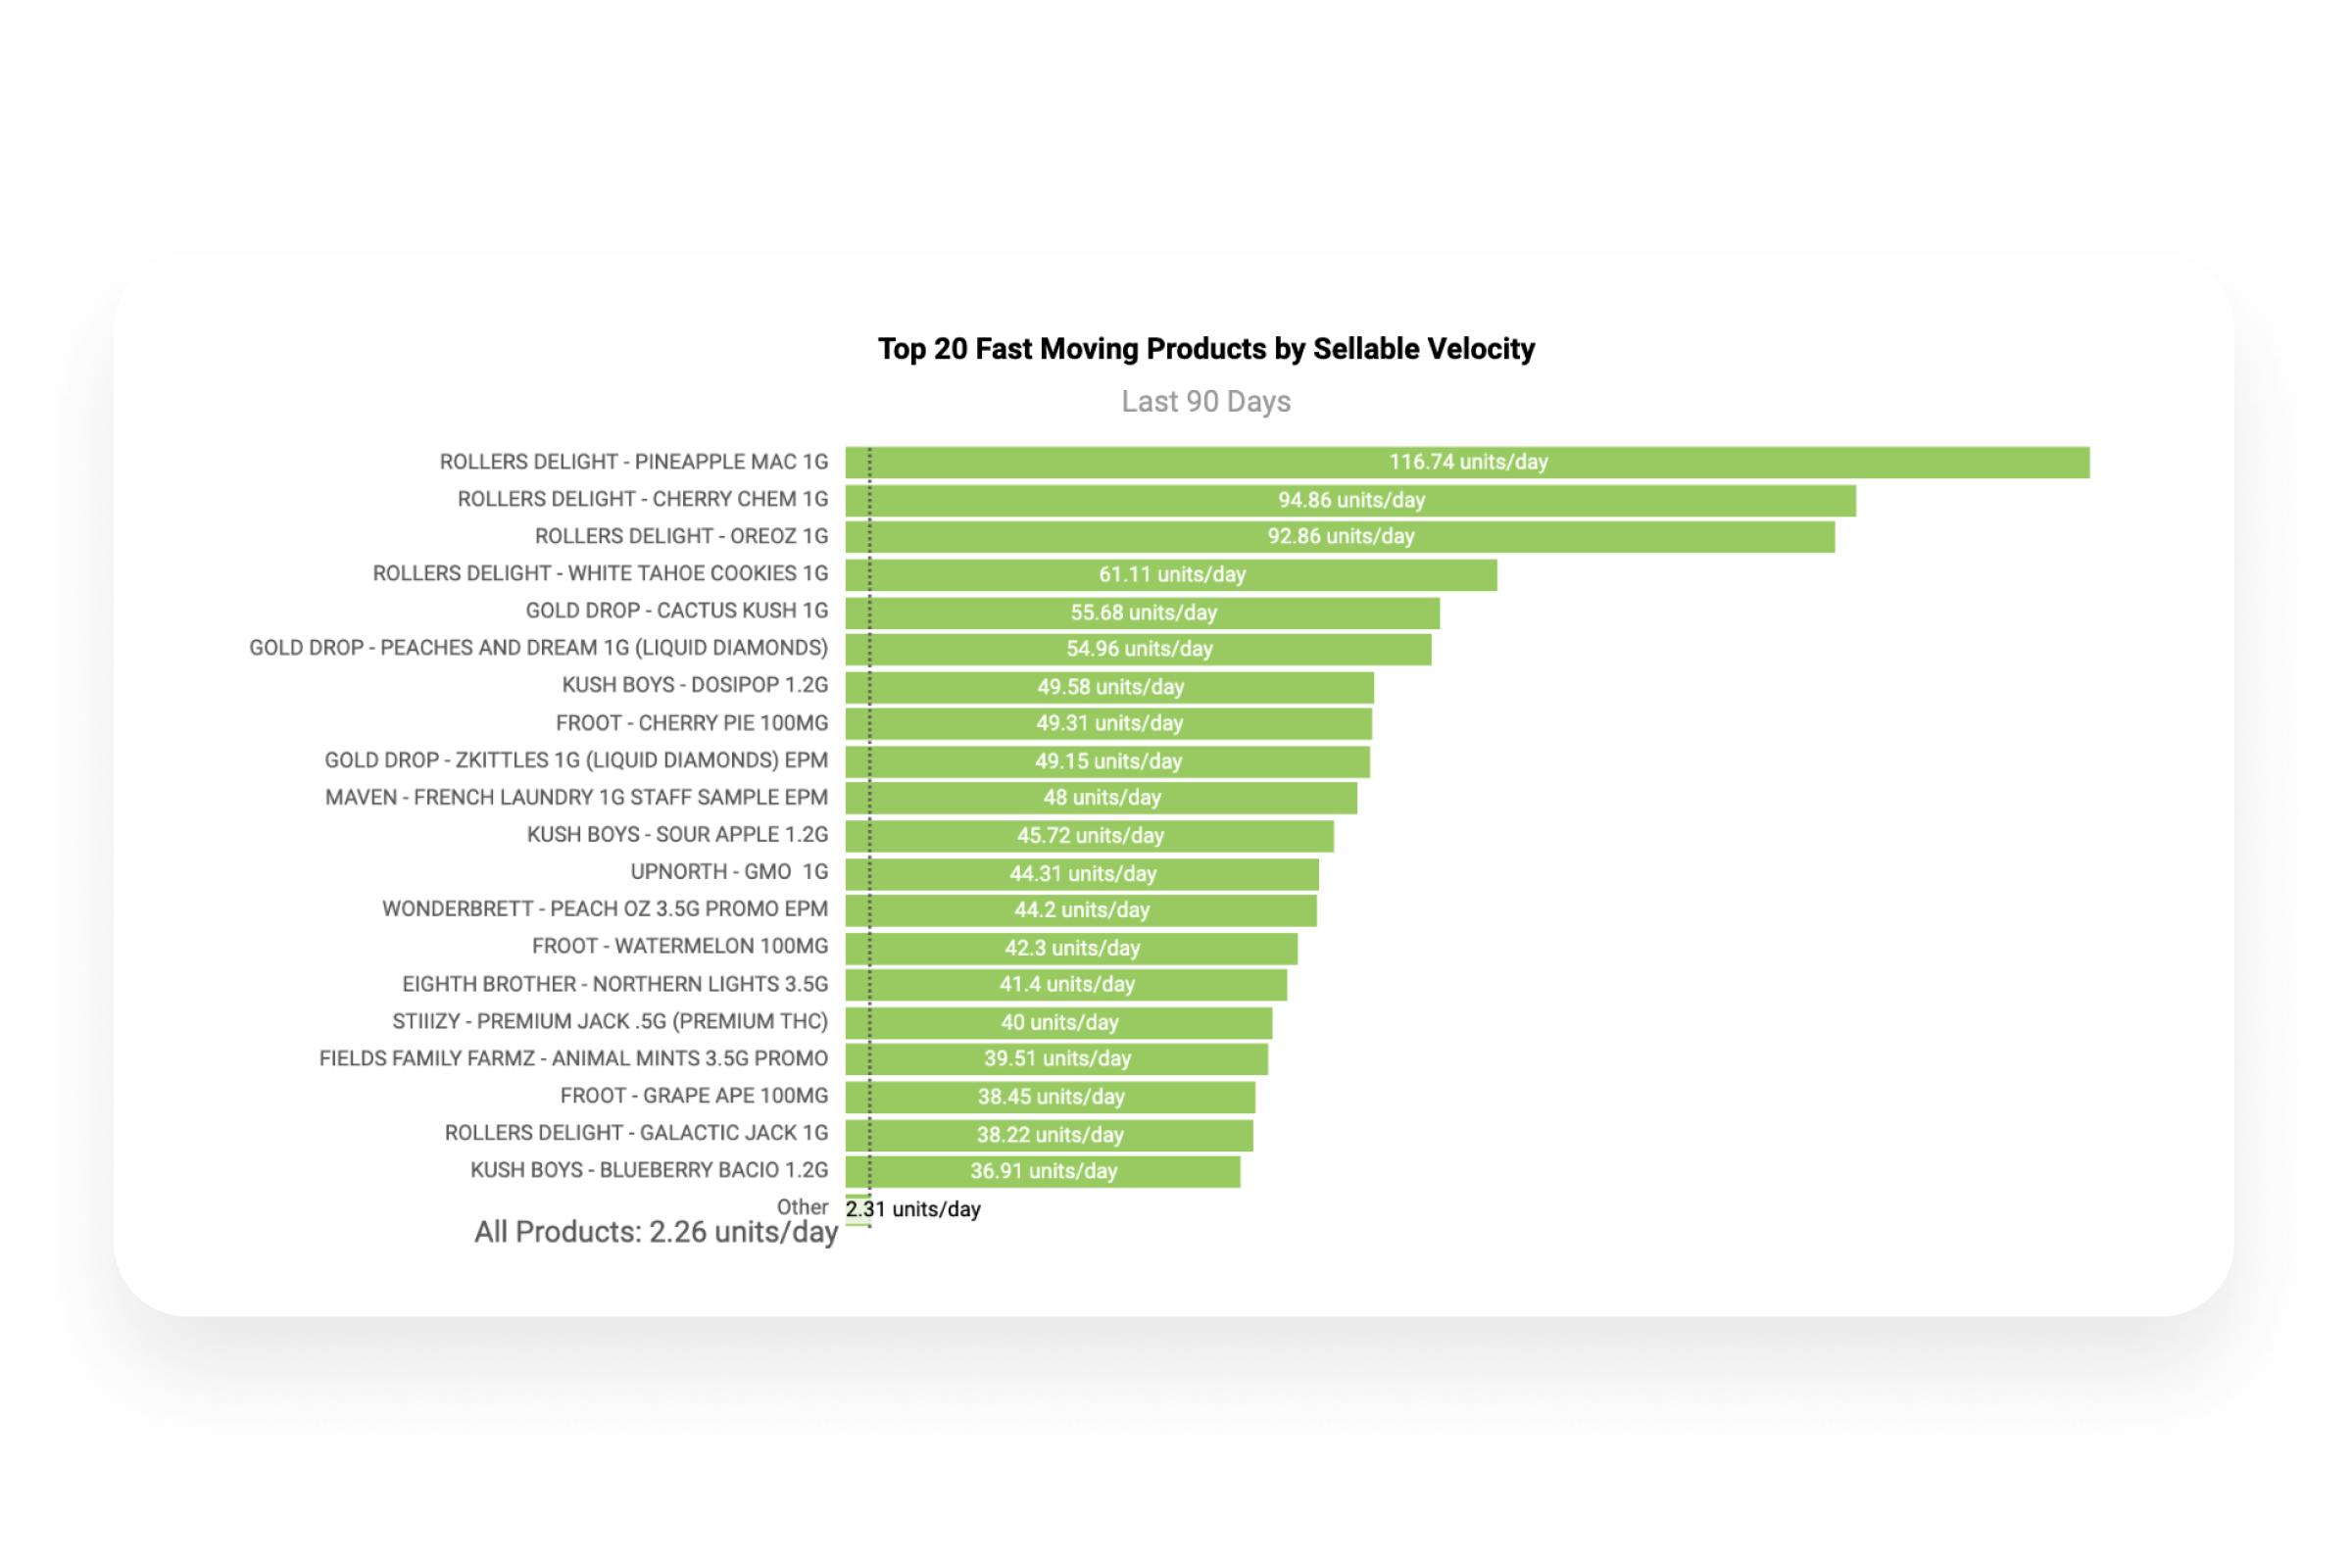
Sellable velocity is a simple, referenceable metric inside Treez for how quickly products move when they are available to be sold.
With Treez Retail Analytics, dispensaries can see how many days after a restock a product is sold out. Because Treez allows you to distinguish which inventory locations products can and cannot be sold from, you can also see how many days that product wasn't sellable, despite inventory on-hand in backstock. Coming soon to Treez-powered retailers, Retail Analytics shows you when somebody didn't replenish the sales floor when they could have, leaving money on the table.
Broken down a bit more, Treez allows you to look at your sales on a particular day, but only on days in which a given product is available on the sales floor (or in another sellable inventory location). Treez can aggregate sellable velocity across product SKUs, product lines, and brand name to understand demand in a way that drives smarter purchasing decisions.
What does this mean for your business?
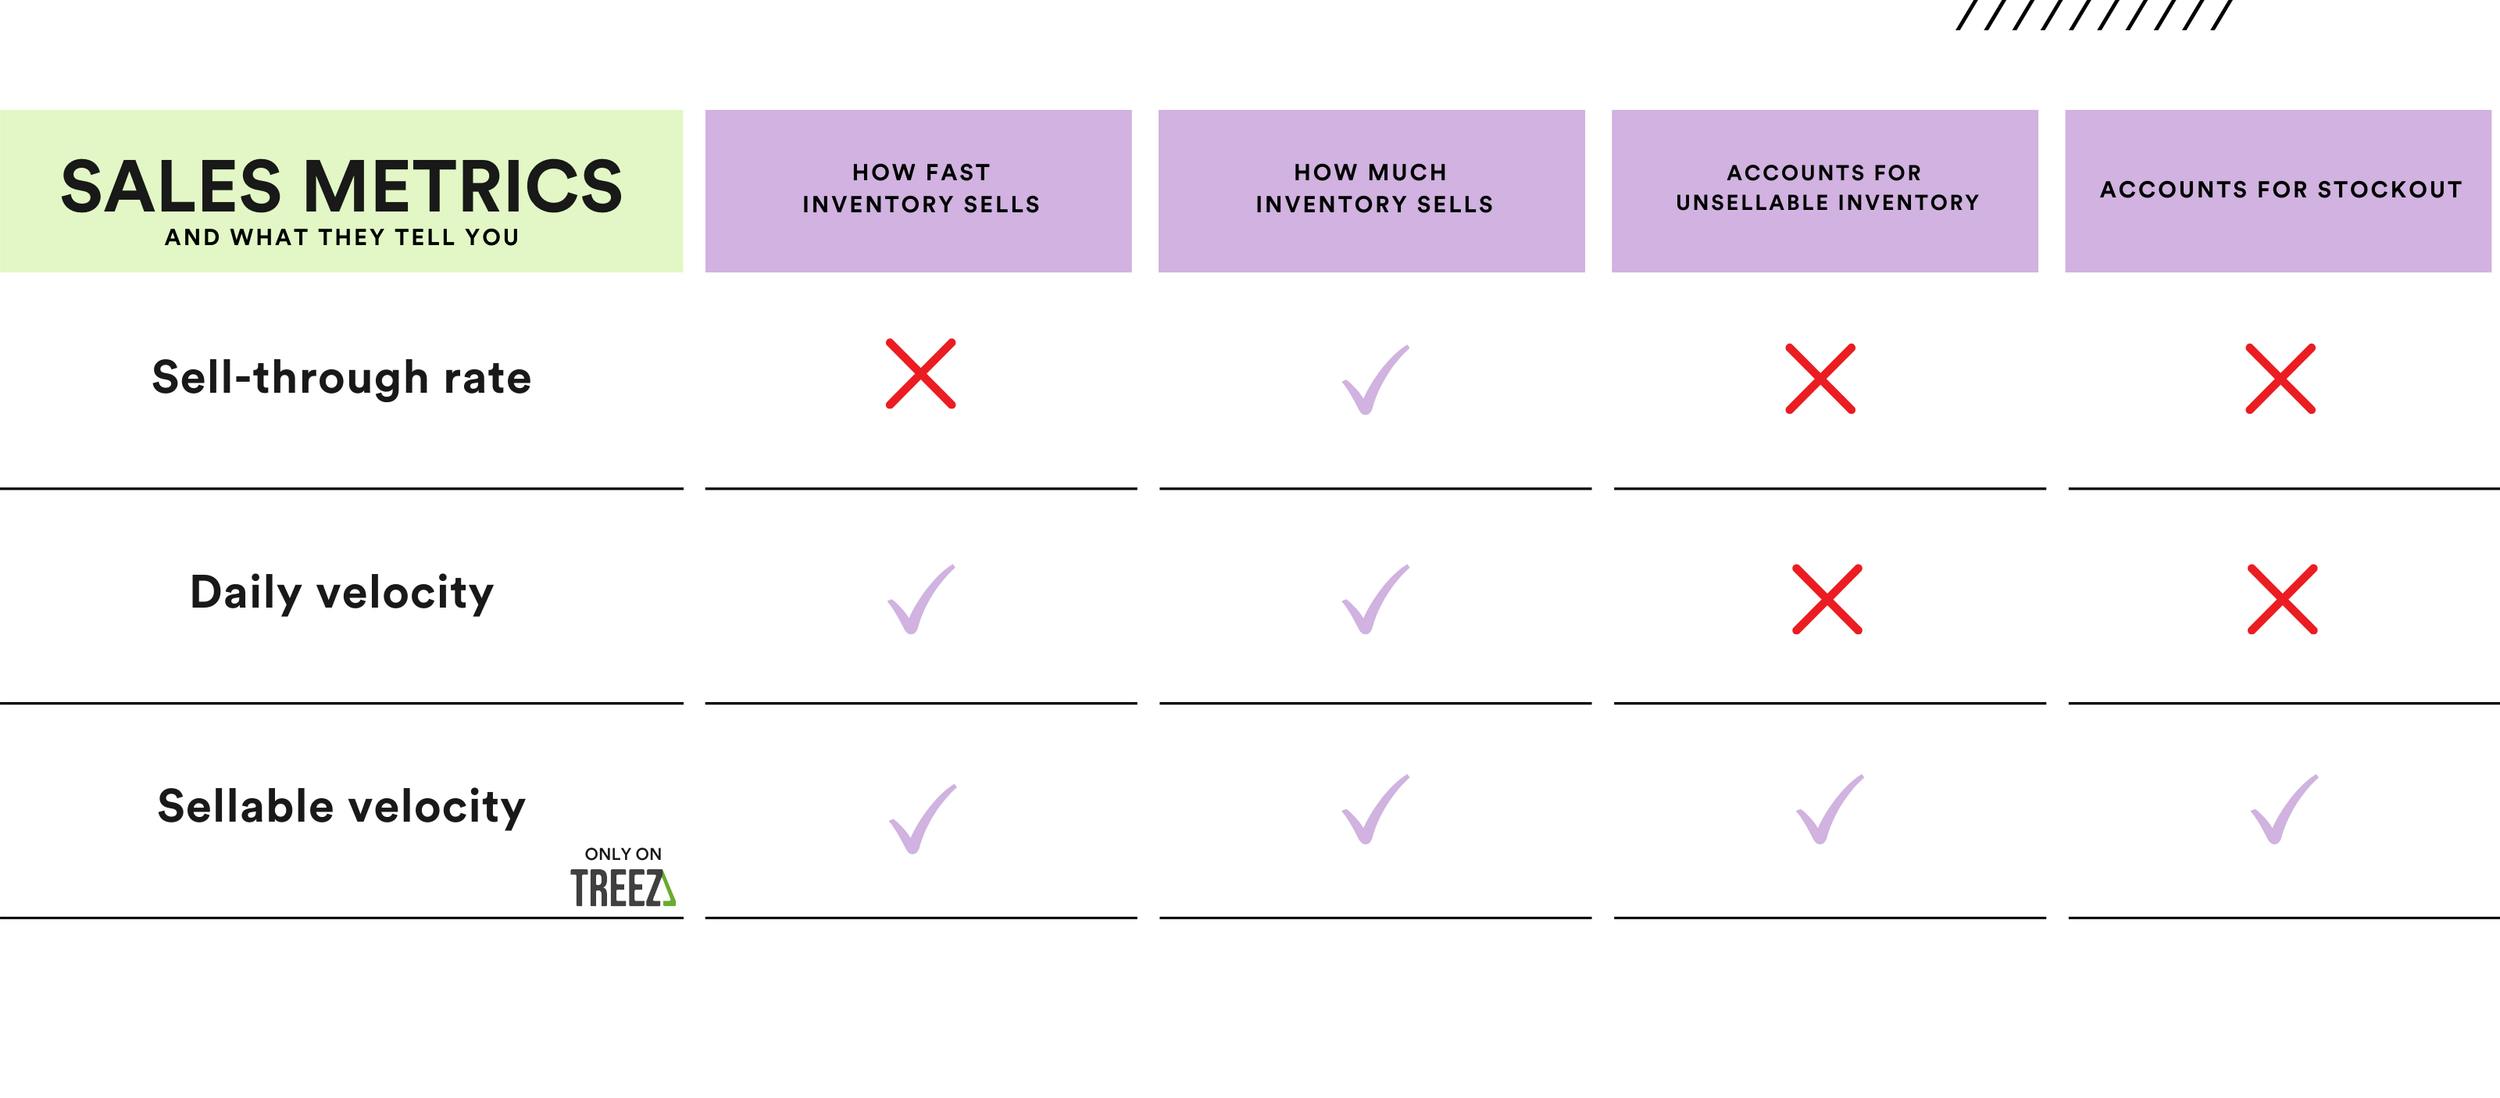
If you're relying on sales velocity or sell-through rate alone, you're likely leaving money on the table.
Sell-through rate (what percentage of a batch of products has sold) might tell you that only 60% of your inventory has sold but it gives you no concept of why or how fast something is moving.
Daily velocity (units sold per day) might tell you that you've only sold 1.5 units per day over the past 30 days – but the product was out of stock for 20 of those days. In that same example, the sellable velocity metric takes the stockout into account and reports back that you could have sold a healthy 4.5 units per day. Sellable velocity paints a more accurate picture of customer demand.
By not leveraging metrics that take real-world inventory availability into account, you risk misreading some of your customers' favorite products as low performers and misallocating your restock investments.
Sellable Velocity:
How we came up with the metric
In our regular conversations with new retailers just starting out and established businesses aiming to improve margins, we heard similar difficulties. Retailers need data that works within the realities of a dispensary. Breaking out high-velocity items by whether they’re available in sellable locations or not is something that resonated with our highly regulated clientele.
Sales velocity wouldn’t cut it, as shown in the example one section up. So we do a little extra work, to find a metric that would allow your team to speak the same language about a product's popularity, while highlighting the problem of lost sales due to missed product replenishment.
How much can this save me?
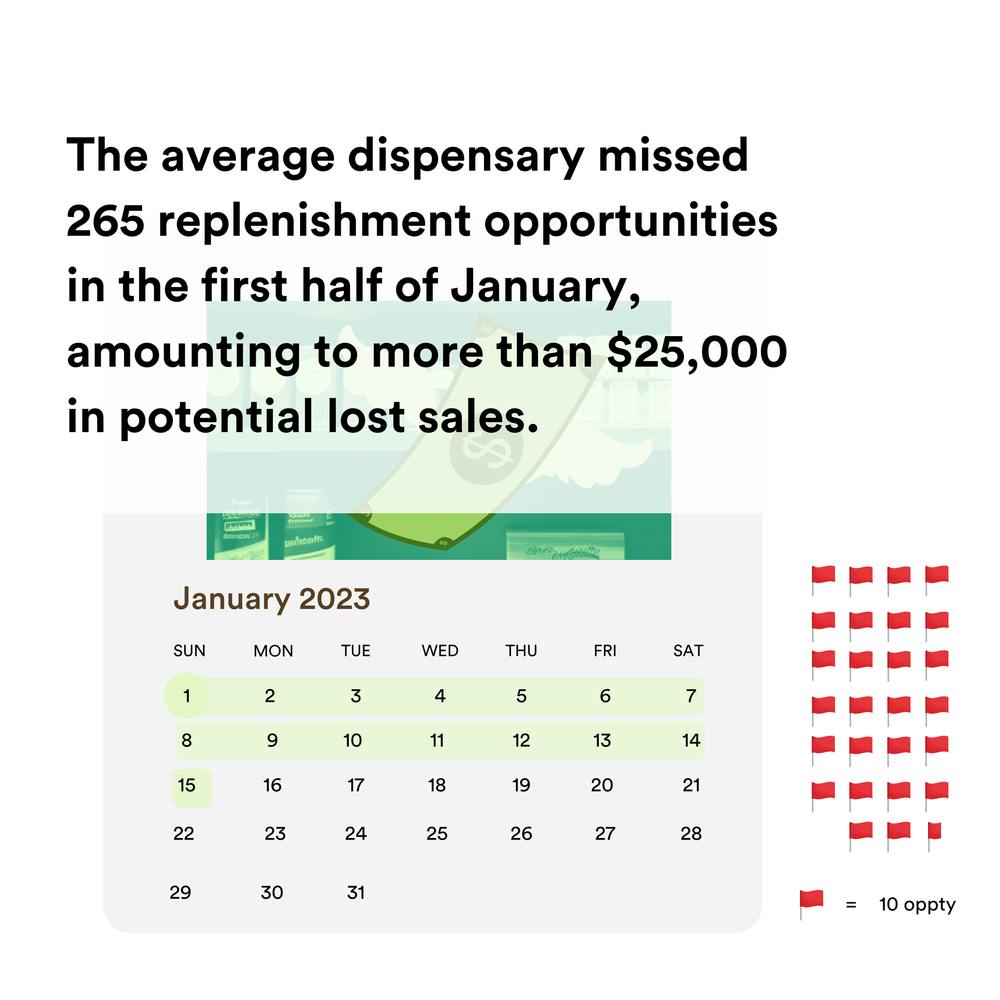
According to Treez sellable velocity data, the average dispensary missed 265 replenishment opportunities in the first half of January, amounting to more than $25,000 in potential lost sales. Multiply that out and you’re looking at more than $600,000 a year in potential lost sales of product that’s sitting inside your retail location.
Maybe some of the customers in this example purchased a similar product and were reasonably happy with their purchase. But why sell second-choice products when first-choice is in-store, just in the wrong location? When a dispensary matches their product stock to its sellable velocity, they can be sure their customers have full choice of the entire menu of products available, in-store or via eCommerce.
I know my top scoring products by sellable velocity, now what?
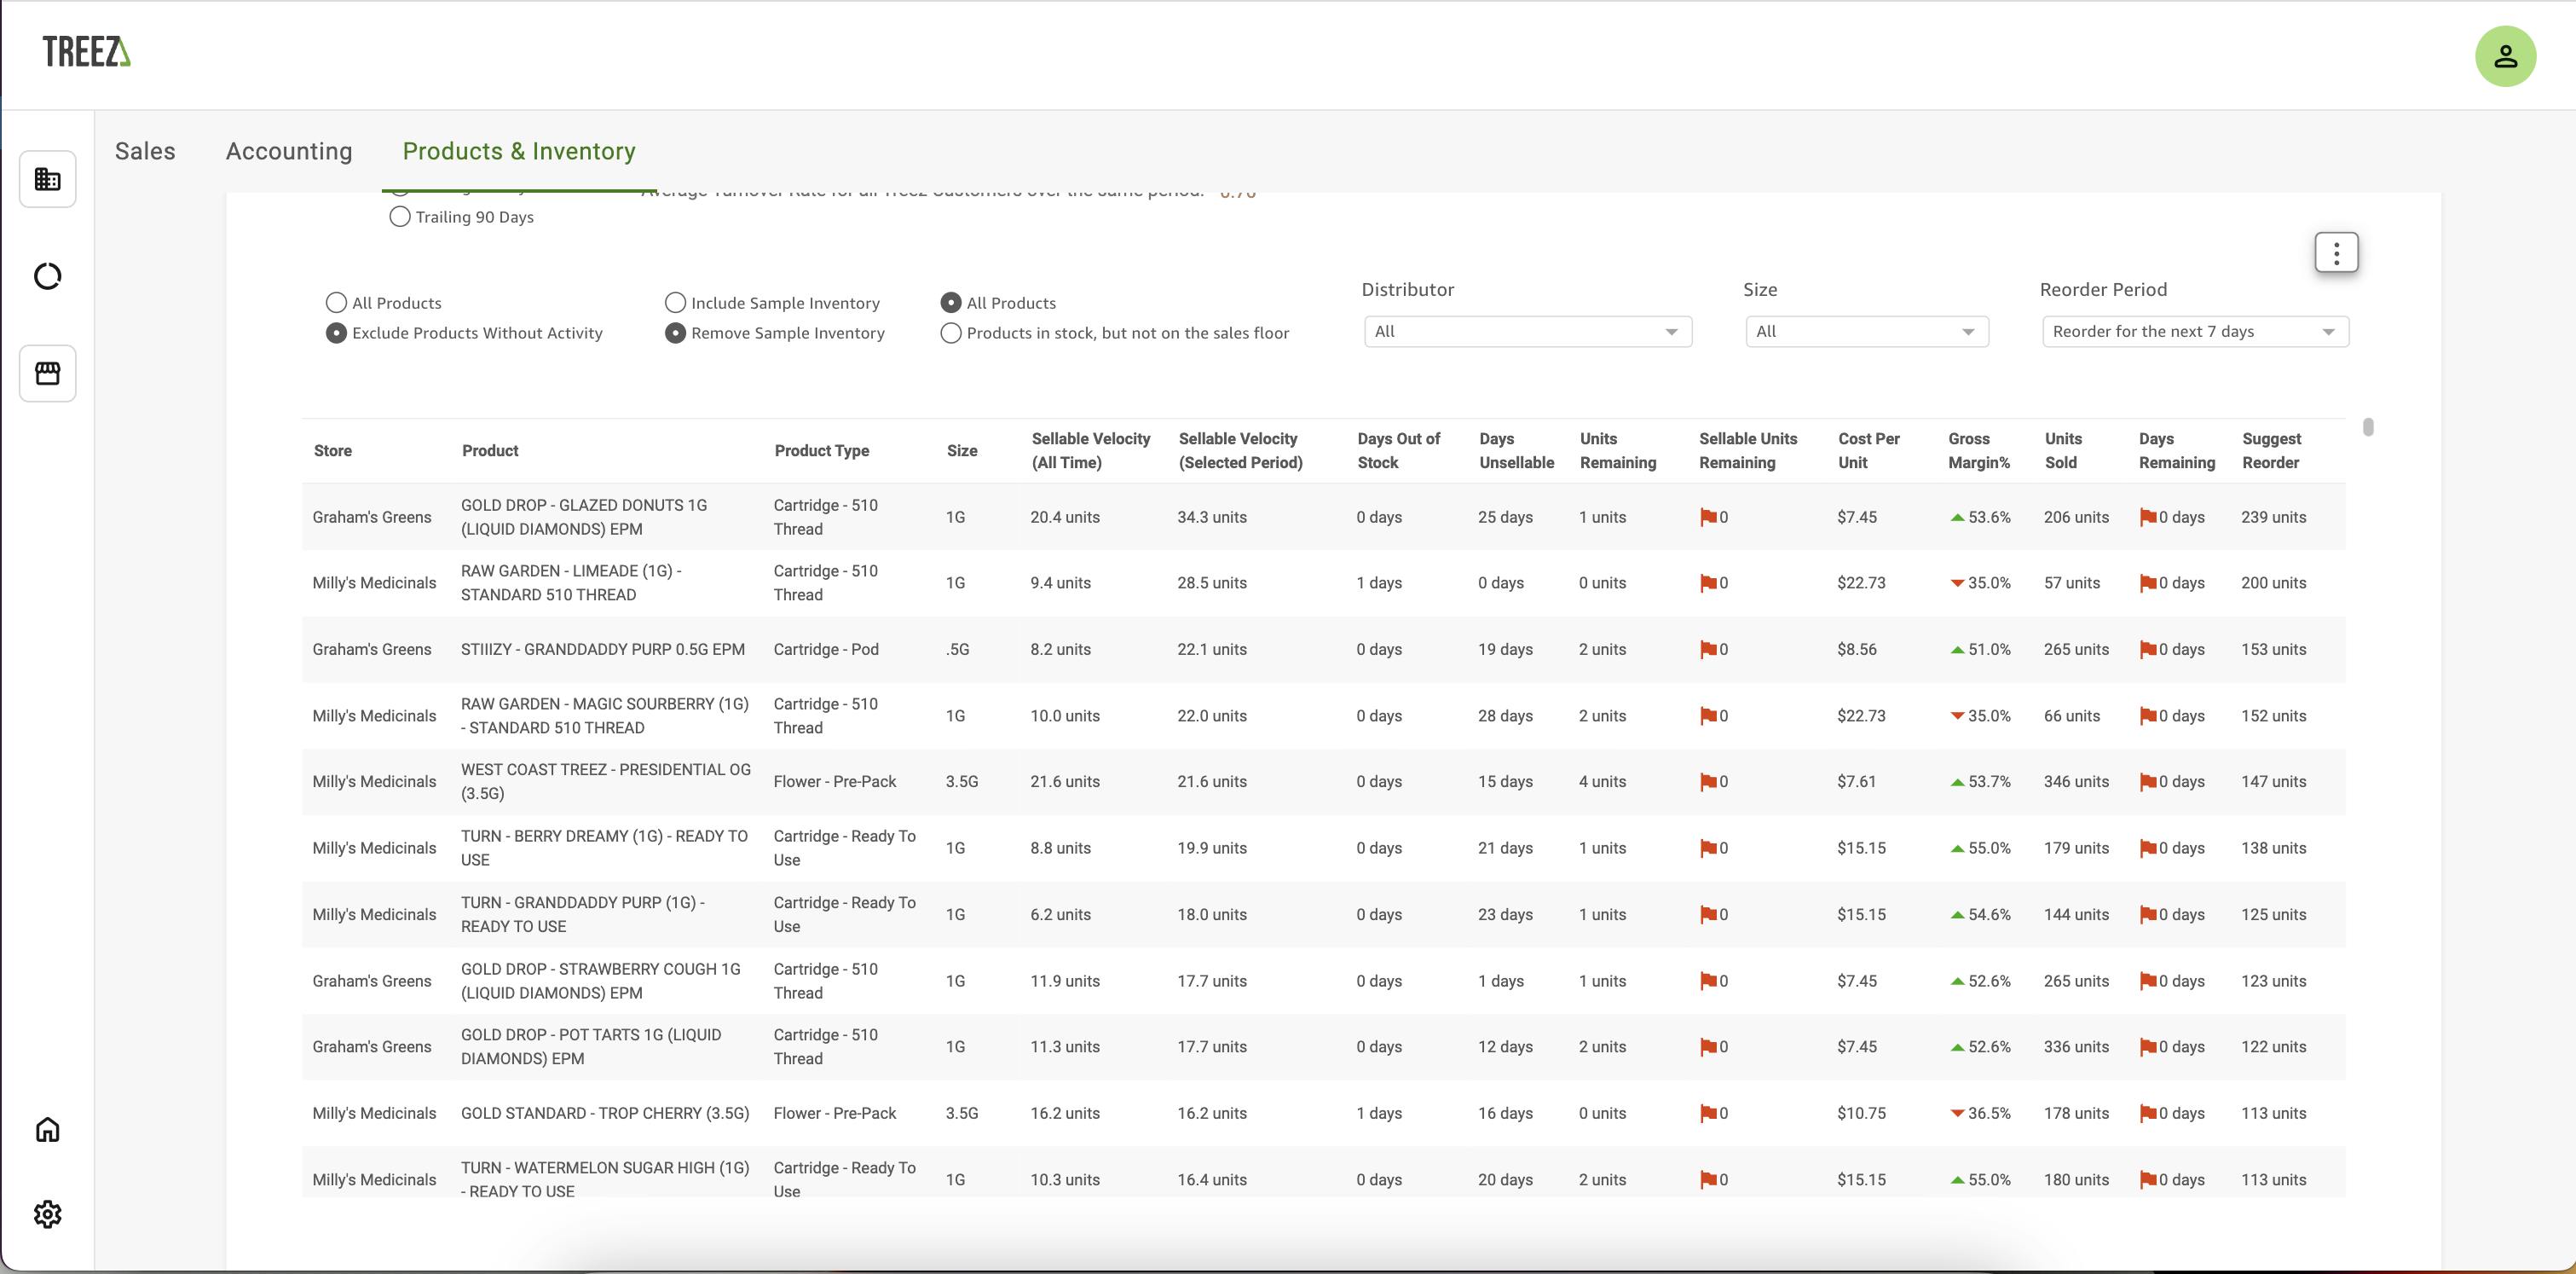
Now you know which products to reorder. The top-scoring products by sellable velocity are ones that you should make sure are stocked as often as possible. Sellable velocity captures the expected demand of the product when it is in stock. Prioritize keeping products with a higher than average sellable velocity in stock at all times.
Products sales, sellable units remaining and suggested reorder amounts, as seen inside the latest version of Treez.
For non-stable products like flower and prerolls (where product SKUs often can’t be reordered directly), pull out sellable velocity across a product line. That will inform which adjacent products from that product line are likely to satisfy demand.
Now you can plan your product assortment.
For example, say right now your store location offers five product lines of gummies, each priced at about $25 to the consumer with different profit margins. Each line has a sellable velocity of 2 units/day. Instead, why not have one or two product lines with high-gross-margins priced around $25 that have a sellable velocity of 10 units/day?
By using sellable velocity and gross margins together (find both under Product Line Performance in Treez Retail Analytics), you can also set up a “good, better, best” style product assortment. Identify your most popular, highest margin product lines at three different price points and offer them to the consumer.
Now your budtenders can focus.
Products with the highest sellable velocity are the products to know and recommend to new and discerning customers. When the sales floor is slammed on a Friday afternoon, budtenders know which products to keep an eye on for inventory.
Sellable velocity also helps to prioritize which products budtenders should become experts in.
They can memorize product information for products that are moving fast, and not waste time or energy on slow-moving stock.
When budtenders share similar knowledge across the products that matter, customers seeking the similar products won't have wildly different experiences at your store based on which budtender took care of them.
Your inventory team has fewer products to count and keep restocked.
They’re zeroed in on restocking the products that customers are looking for before you run out. They can prioritize their restocks and trust their sellable numbers.
Purchasing managers can streamline their vendor count to only the best performing ones. That means fewer weekly or monthly purchasing meetings with brands and fewer brand reps to deal with. Plus, when you build a data-driven streamlined brand assortment, the potential for more wholesale discounts goes way up. Purchasing can negotiate with brands with data tied to product performance and sellable velocity on their side.
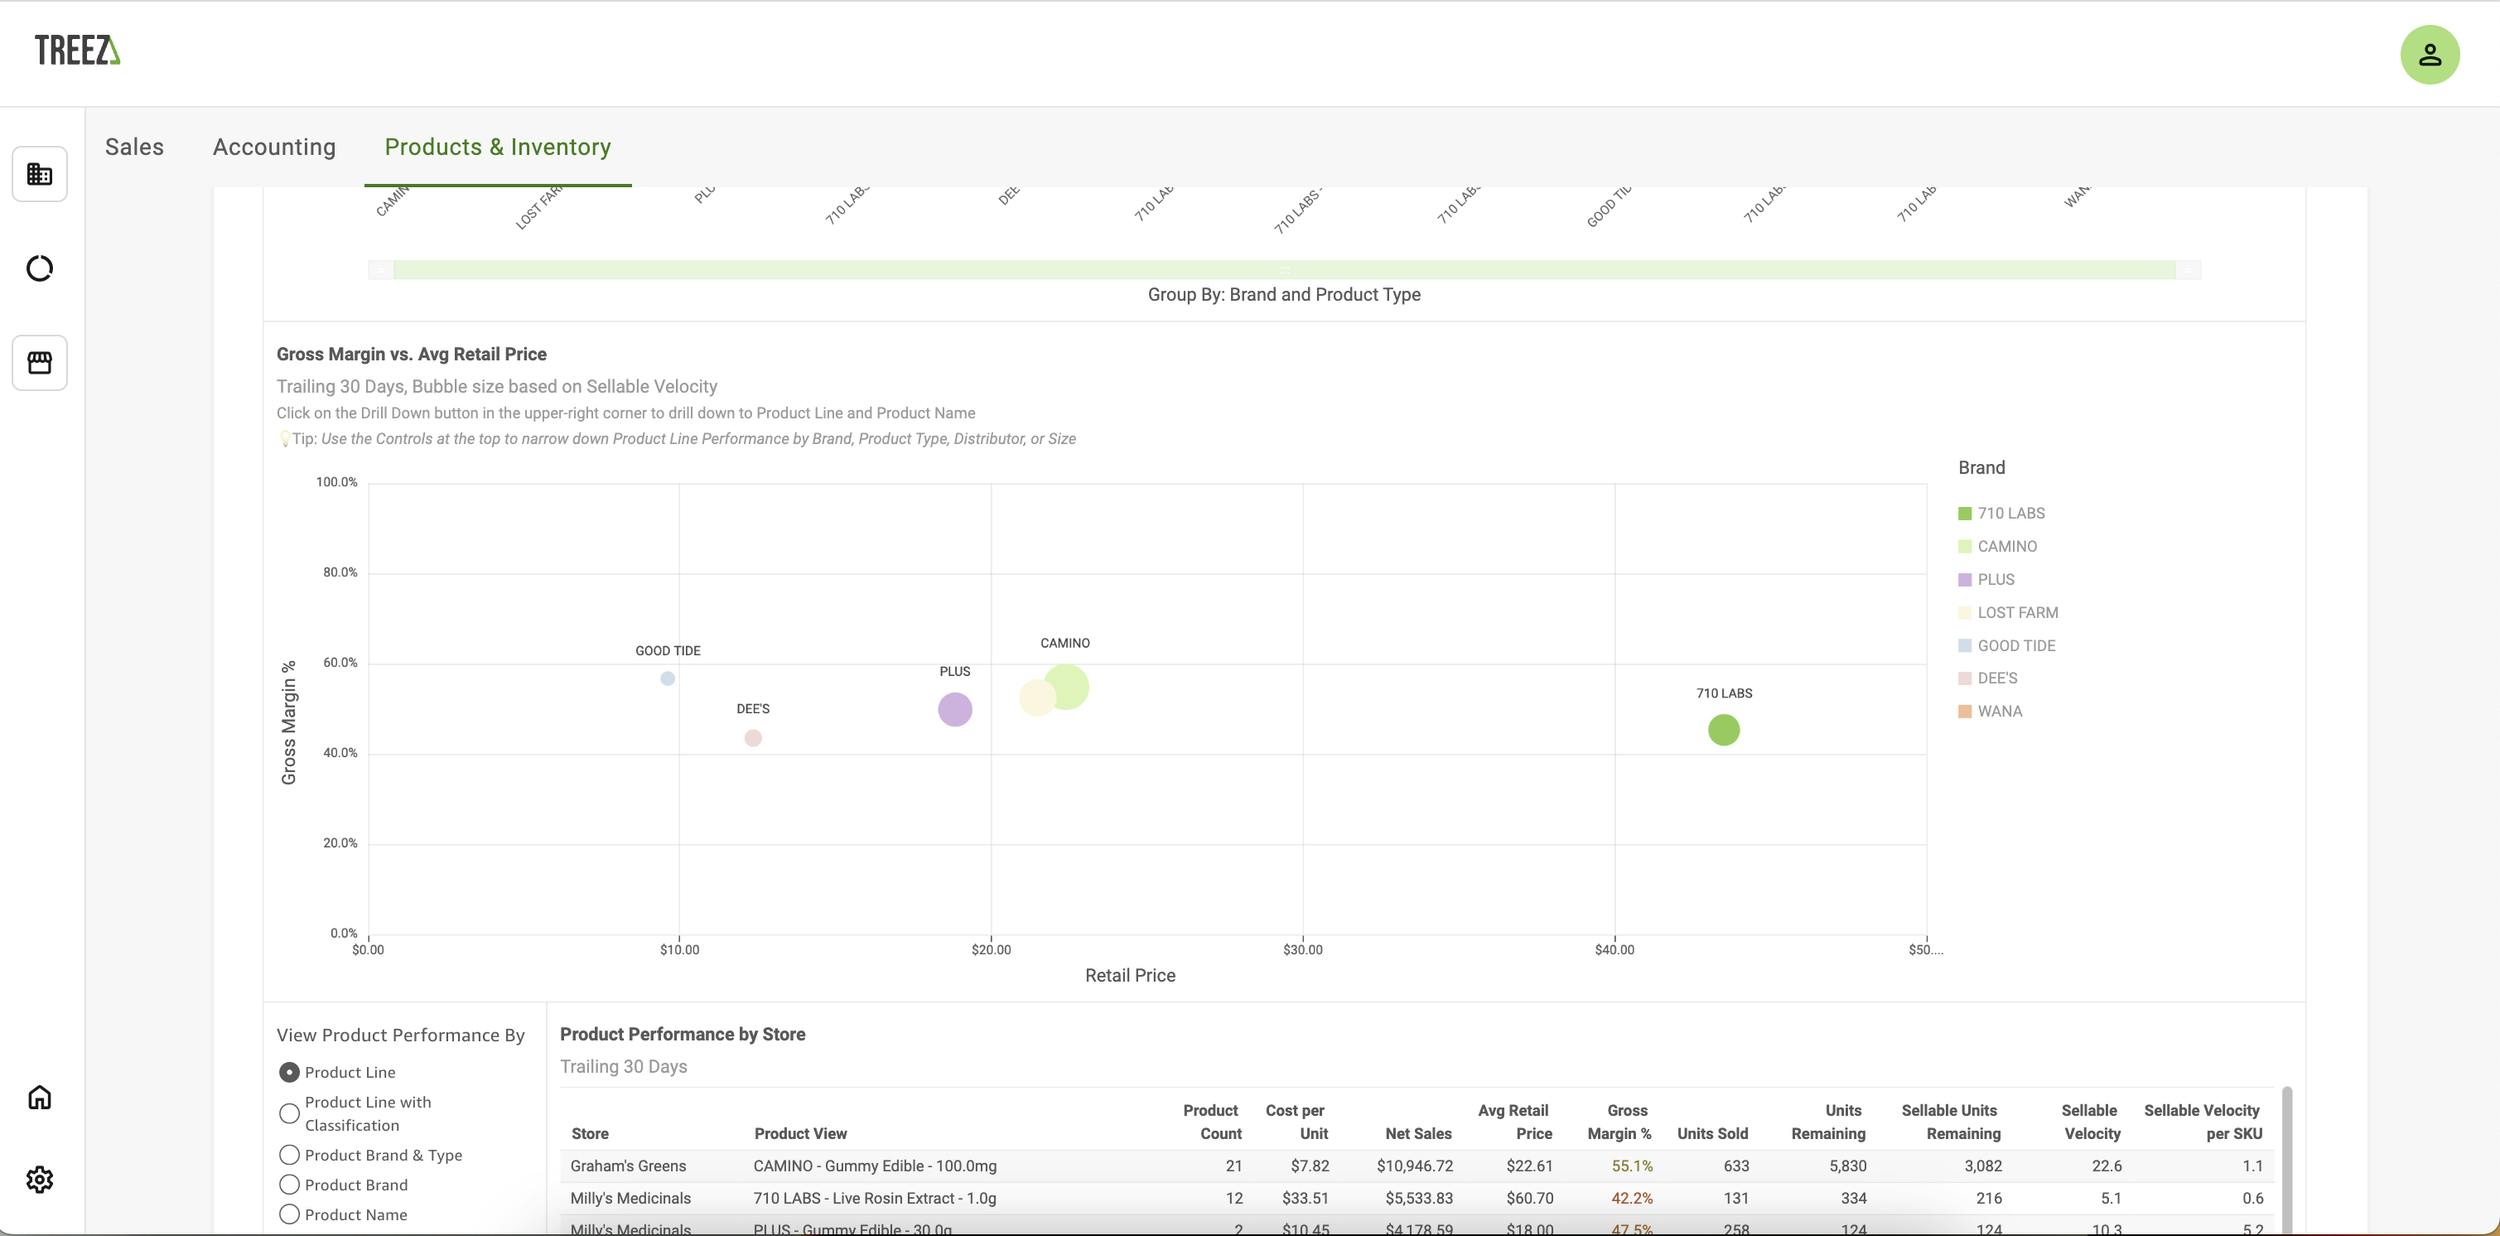
Product and Inventory - Gross Margin vs. Avg Retail Price. Use this view with high sellable velocity products to find where to adjust margins and prices. Inside Retail Analytics in the latest version of Treez.
Sellable velocity is an actionable piece of data you can start using to improve your dispensary’s performance today. If you want to learn more about our Retail Analytics product, check out our announcement blog here.
And if you’re ready to sell more products, at a better margin, Treez can help.
Book a demo today to discuss your sales goals with a Treez representative.
Already a Treez customer? Connect with your customer support manager to discuss Retail Analytics and the latest version of Treez.